


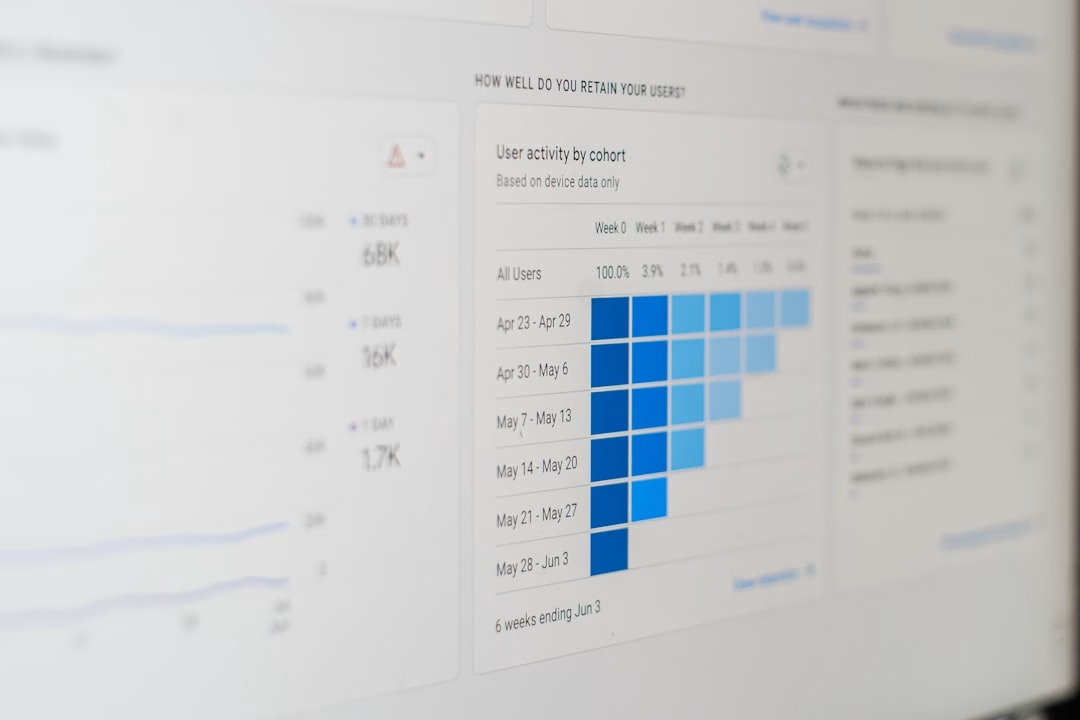
So, you’ve got a marketing campaign running, and you’re probably wondering what’s actually happening. Are people clicking? Are they converting? Is that budget we’re spending actually doing anything? This is precisely where real-time dashboards come into play. Think of them as your campaign’s live heartbeat monitor. Instead of waiting for end-of-day reports or sifting through mountains of spreadsheets, a real-time dashboard gives you instant access to the most critical data, allowing you to make quick, informed decisions while your campaign is still live. This isn’t about fancy graphics; it’s about having the information you need, when you need it, to steer your campaign towards better results.
Let’s cut to the chase. Why bother with “real-time” when older methods always seemed to work? The digital landscape moves at lightning speed. Customer behavior shifts, competitor actions change, and platform algorithms are constantly tweaking. Waiting even a few hours for data can mean missing a crucial opportunity or failing to address a problem before it escalates. Real-time dashboards bridge that gap, offering a direct line of sight into your campaign’s performance as it unfolds.
Speeding Up Your Decision-Making Muscle
Imagine you’re running an ad campaign on social media, and you notice a particular ad creative is getting a lot of clicks but very few conversions. Without a real-time view, you might not see this disconnect for hours, or even a day. By the time you realize it, you’ve already spent a significant chunk of your budget on an underperforming ad. With a real-time dashboard, you see this immediately. You can pause that ad, reallocate budget to a better performing one, or quickly swap out the creative. This agility is what separates campaigns that tread water from those that really fly.
Catching Bombs Before They Explode (Or, Problem Detection)
Campaigns rarely go perfectly. Technical glitches happen. Targeting might be off. A sudden competitor promotion could be siphoning off your audience. Real-time dashboards highlight these issues as they emerge. A sudden drop in click-through rates, a spike in bounce rates on your landing page, or an unexpected increase in cost-per-acquisition are all red flags you can spot instantly. This early warning system allows you to investigate and rectify problems before they significantly impact your overall campaign goals.
Spotting Opportunities as They Bloom
It’s not just about fixing problems; it’s also about seizing opportunities. Real-time data can reveal unexpected pockets of success. Perhaps a particular audience segment is responding incredibly well to your messaging, or a specific keyword is driving exceptionally high conversion rates. Seeing this live allows you to double down. You can increase bids for those keywords, expand targeting to similar audiences, or amplify the successful ad creative across other platforms. This proactive approach to capitalizing on wins is a key differentiator.
Keeping Everyone on the Same Page
In larger teams or with multiple stakeholders, a shared real-time dashboard acts as a single source of truth. Everyone is looking at the same live data, fostered by immediate understanding and alignment. This reduces the need for constant status meetings and email chains trying to decipher conflicting reports. It promotes transparency and allows for more collaborative, faster decision-making.
In today’s fast-paced marketing landscape, real-time dashboards have become essential tools for marketers to effectively act on live campaign data. By providing instant insights into campaign performance, these dashboards enable marketers to make informed decisions and optimize their strategies on the fly. For further exploration of how technology can enhance marketing efforts, you may find the article on unleashing the power of RSS to email automation particularly insightful, as it discusses innovative approaches to streamline communication and engagement with audiences.
Building Your Campaign Command Center: What Data to Prioritize
Okay, so you’re sold on the “why.” But what should actually be on your real-time dashboard? Trying to cram every single metric in there will just create noise. The key is to focus on the data points that directly tie into your campaign’s objectives and allow for immediate action.
The Core Performance Indicators (KPIs) You Can’t Ignore
These are the numbers that tell you if your campaign is fundamentally working. They should be front and center.
Traffic and Engagement Metrics
- Impressions: How many times has your ad or content been displayed? This gives you a sense of reach.
- Clicks: How many people are interacting with your ad or content? This indicates initial interest.
- Click-Through Rate (CTR): The percentage of impressions that result in a click. A fundamental measure of ad relevance and appeal.
- Sessions/Pageviews: For website traffic, how many visits are you getting?
- Bounce Rate: The percentage of visitors who leave your site after viewing only one page. High bounce rates can indicate irrelevant traffic or poor landing page experience.
- Time on Page/Session Duration: How long are people engaging with your content once they arrive?
Conversion Metrics (The Money Makers)
- Conversions: This is the holy grail. What specific action are you trying to drive? This could be a sale, a lead form submission, a download, a sign-up, etc.
- Conversion Rate: The percentage of clicks or sessions that result in a conversion. This is a critical efficiency metric.
- Cost Per Acquisition (CPA) / Cost Per Conversion: How much are you spending to achieve each desired conversion? This directly impacts your ROI.
- Return on Ad Spend (ROAS): For campaigns where revenue is directly tied to ad spend, this measures how much revenue you’re generating for every dollar spent.
- Leads Generated: Specifically for lead generation campaigns.
- Sales Value: The total revenue generated.
Audience and Acquisition Insights
- Device Type: Are users primarily on mobile, desktop, or tablet? This can influence landing page design and ad format.
- Location: Where are your conversions coming from? Are there certain regions performing significantly better or worse?
- Traffic Source/Channel: Which platforms (Google Ads, Facebook, organic search, etc.) are driving the most valuable traffic and conversions?
- Demographics (if relevant and available): Age, gender, etc. to understand who is converting.
Actionable Insights, Not Just Raw Numbers
Remember, a dashboard isn’t just a pretty spreadsheet. The data needs to tell you something you can do.
Understanding “Good” vs. “Bad”
- Real-time Benchmarks: Where do your current numbers stand against your historical averages or pre-set goals? Is your CTR suddenly dropping below your typical performance?
- Trend Analysis: Is performance trending upwards, downwards, or staying stable? This helps you forecast and adjust.
- Channel Performance Comparisons: How does your Facebook campaign’s CPA stack up against your Google Ads campaign’s CPA?
Predictive Indicators
- Engagement Trends: Is time on page increasing or decreasing? This can be a leading indicator of interest or disinterest before a conversion happens.
- Early Conversion Signals: Are there specific user behaviors on the landing page that often precede a conversion?
Bringing Your Dashboard to Life: Tools and Strategies

You don’t need to be a coding wizard to build a functional real-time dashboard. There are a variety of tools and approaches available, depending on your budget and technical capabilities.
Leveraging Platform-Native Dashboards
Most digital advertising platforms offer their own built-in analytics and reporting dashboards. These are often the quickest and easiest way to get started.
Google Ads
- What it shows: Performance across Search, Display, Shopping, Video, etc.
- Key features: Real-time bid adjustments, ad strength indicators, audience insights.
- Actionability: You can see which keywords are driving conversions, which ad groups are performing poorly, and adjust bids or ad copy directly within the platform.
Facebook/Instagram Ads Manager
- What it shows: Performance across various ad objectives (awareness, consideration, conversion).
- Key features: Detailed audience breakdown, creative performance by placements, real-time spend tracking.
- Actionability: Pause underperforming ad sets, reallocate budget to better-performing creatives, and adjust targeting on the fly.
Other Platforms
- LinkedIn Ads, Twitter Ads, Pinterest Ads: Each has its own robust reporting interfaces that provide near real-time data.
- Google Analytics: While not strictly an “ad campaign” dashboard, it’s crucial for understanding website behavior after users click through from ads. It offers real-time visitor tracking and acquisition source analysis.
Dedicated Dashboarding Tools
For a more consolidated view or more advanced customization, dedicated dashboarding tools are excellent. These tools often pull data from multiple sources into one unified interface.
Google Data Studio (Looker Studio)
- What it is: A free, web-based tool that connects to various data sources, including Google Ads, Google Analytics, spreadsheets, and more.
- Key features: Highly customizable visualizations, report sharing, embedding capabilities.
- Actionability: Create a single dashboard that pulls in data from all your active campaigns across different platforms, offering a holistic view. It’s excellent for tracking cross-channel performance and creating a unified view of campaign health.
Tableau, Power BI, and Others
- What they are: Powerful business intelligence tools. They require more technical expertise but offer unparalleled flexibility and data integration capabilities.
- Key features: Advanced data manipulation, complex visualizations, predictive analytics.
- Actionability: For organizations with complex data needs, these tools can build sophisticated, real-time dashboards that integrate data from CRM systems, sales databases, and marketing platforms for a truly comprehensive view.
The Art of Data Integration
The real power comes when you connect the dots.
Connecting Your Ad Platforms to Your Analytics
- Why it matters: Understanding what happens after the click is as important as the click itself. Linking your ad platform data to Google Analytics (or a similar tool) allows you to see user journeys, landing page performance, and eventual goal completions.
- How to do it: UTM parameters are your best friend here. Properly tagging all your campaign URLs ensures that Google Analytics accurately attributes traffic and conversions back to the specific ad or campaign that drove it. This is a fundamental step for any serious digital marketer.
Pulling in CRM Data
- Why it matters: For B2B or long-sales cycle businesses, a lead from an ad campaign is just the beginning. Integrating CRM data into your dashboard can show you which ad campaigns are generating leads that ultimately turn into paying customers and what the lifetime value of those customers is.
- How to do it: Many dashboarding tools have connectors for popular CRMs like Salesforce, HubSpot, etc. This allows you to see the full funnel, from initial ad impression to closed deal.
The Mechanics of Action: Turning Data into Decisions
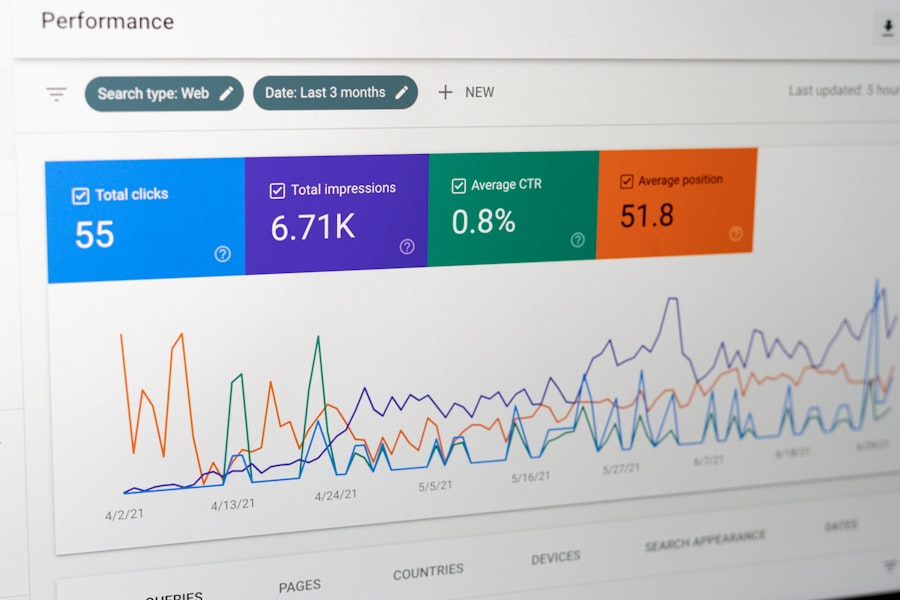
A dashboard is only as good as the actions you take based on it. Here’s how to ensure your real-time data translates into tangible improvements.
Setting Up Alerts and Triggers
Don’t wait to log in and check your dashboard every five minutes. Set up automated alerts.
Threshold Alerts
- What they are: Notifications that trigger when a specific metric crosses a pre-defined threshold.
- Examples:
- “Alert me if CPA for Campaign X exceeds $50.”
- “Notify me if CTR for Ad Group Y drops below 1%.”
- “Send an alert if Conversion Rate for Landing Page Z goes below 2%.”
- Benefit: This frees you from constant monitoring while ensuring you’re immediately informed of critical performance changes.
Anomaly Detection Alerts
- What they are: More sophisticated alerts that flag unusual spikes or dips in data that deviate significantly from historical patterns, even if they don’t cross a fixed threshold.
- Benefit: Can catch subtle issues or sudden shifts that you might not have anticipated with fixed thresholds.
Making the “Quick Wins” List
Some data points lend themselves to immediate action.
Budget Reallocation
- The scenario: You notice one ad set or campaign is significantly outperforming others in terms of CPA or ROAS.
- The action: Shift budget from underperforming areas to the top performers. This is a direct lever you can pull to maximize efficiency.
Pausing and Tweaking Ads/Keywords
- The scenario: An ad creative has a very low CTR and poor conversion rate. A keyword is costing money but not generating any leads.
- The action: Immediately pause the underperforming ad or keyword. Pause it, analyze why it failed, and then consider replacing it with something new or focusing your efforts elsewhere.
Landing Page Adjustments
- The scenario: High clicks but a high bounce rate on your landing page.
- The action: Make immediate, small adjustments. Is the headline clear? Is the call to action prominent? Is the page load speed acceptable? Even minor tweaks can have a noticeable impact.
The “What If” Scenarios for Optimization
Think beyond just fixing problems. Use real-time data to explore possibilities.
A/B Testing on the Fly
- The scenario: You have a hunch that a different headline or image might perform better.
- The action: Use your real-time dashboard to monitor the performance of an ongoing A/B test. If one variant is clearly winning, consider rolling it out more broadly, or at least learning from its success for future tests.
Audience Expansion or Refinement
- The scenario: You see a particular demographic or interest group is converting at an exceptionally high rate.
- The action: Explore expanding your targeting to include similar audiences or increasing bids for that specific segment. Conversely, if an audience is performing poorly, refine or exclude it.
Real-time dashboards are essential for marketers looking to optimize their campaigns based on live data, enabling them to make informed decisions quickly. For those interested in enhancing their marketing strategies further, an insightful article on boosting customer retention through trigger-based emails can provide valuable techniques and insights. You can read more about it in this related article, which complements the discussion on how real-time analytics can drive effective marketing efforts.
The Human Element: Beyond the Numbers
| Benefits of Real-Time Dashboards for Marketers | Explanation |
|---|---|
| Immediate Insights | Marketers can quickly see how their campaigns are performing and make necessary adjustments in real time. |
| Optimized Campaigns | Live data allows marketers to optimize their campaigns on the fly, ensuring maximum effectiveness. |
| Improved Decision Making | Real-time dashboards provide the information needed to make informed decisions and react to changing market conditions. |
| Enhanced ROI | By acting on live campaign data, marketers can improve their return on investment and maximize their advertising spend. |
While real-time dashboards are all about data, their ultimate success hinges on the human intelligence behind them.
Avoiding Data Paralysis
It’s easy to get overwhelmed by a constant stream of data. The key is to have a clear process for what to look for and what actions to take. Don’t just stare at the numbers; use them.
The Importance of Context
Data doesn’t exist in a vacuum. Always consider the broader context.
- External Factors: Was there a holiday? A major news event? A competitor’s launch? These can all influence campaign performance.
- Campaign Goals: Are you optimizing for clicks, leads, or sales? The same data point can mean different things depending on your ultimate objective.
- Seasonality: For some businesses, performance naturally fluctuates with the seasons.
Continuous Learning and Iteration
Real-time dashboards are not a set-it-and-forget-it solution. They are tools for continuous learning and optimization. What you learn from one campaign’s real-time data should inform your strategy for the next.
- Post-Campaign Analysis: Even after the campaign ends, review the real-time data you collected. What were the key turning points? What did you learn?
- Refining Your Dashboard: As your campaigns evolve and your understanding grows, so too should your dashboard. Add new metrics that become important, remove those that are no longer relevant, and refine your alerts.
In short, real-time dashboards are your campaign’s immediate feedback loop. They empower you to be proactive, efficient, and adaptable in the fast-paced world of digital marketing. By focusing on the right data, leveraging appropriate tools, and most importantly, acting on the insights they provide, you can move from simply running campaigns to actively managing and optimizing them for better results.
FAQs
What is a real-time dashboard?
A real-time dashboard is a data visualization tool that displays live, up-to-the-minute information in a graphical format. It allows users to monitor key metrics and KPIs in real-time, enabling quick decision-making and action.
How do real-time dashboards help marketers?
Real-time dashboards help marketers by providing immediate access to live campaign data, allowing them to monitor performance, identify trends, and make adjustments in real-time. This enables marketers to optimize their campaigns for better results.
What are the benefits of using real-time dashboards for marketing campaigns?
Some benefits of using real-time dashboards for marketing campaigns include the ability to react quickly to changing market conditions, optimize campaign performance, identify and address issues as they arise, and make data-driven decisions in real-time.
What types of data can be displayed on a real-time dashboard for marketers?
Real-time dashboards for marketers can display a wide range of data, including website traffic, social media engagement, email open rates, conversion rates, ad performance, and other key marketing metrics.
How can marketers use real-time dashboards to act on live campaign data?
Marketers can use real-time dashboards to act on live campaign data by monitoring performance, identifying areas for improvement, making adjustments to campaigns in real-time, and leveraging insights to optimize marketing strategies for better results.