



Unveiling Your Email Performance with Data-Driven Insights
You’ve poured your heart and soul into crafting compelling email campaigns. You’ve segmented your lists, written persuasive copy, designed eye-catching visuals, and carefully timed your sends. But how do you know if all that effort is actually paying off? This is where email campaign reports become your indispensable ally. They transform raw data into actionable intelligence, empowering you to move beyond guesswork and make informed decisions that elevate your marketing strategy. Think of these reports not as a mere collection of numbers, but as a roadmap to understanding your audience, refining your approach, and ultimately, achieving your marketing objectives. Without a deep dive into these metrics, you’re essentially flying blind, unable to discern what resonates with your subscribers and what falls flat.
Understanding how email campaign reports can enhance marketing decisions is crucial for any business looking to improve its outreach. For those interested in further optimizing their email strategies, a related article titled “Optimizing Your Email with Split Testing: From Good to Great” provides valuable insights on how to leverage split testing to refine email content and increase engagement. You can read more about it here: Optimizing Your Email with Split Testing: From Good to Great.
Understanding the Core Metrics That Matter

Before you can leverage reports for better decisions, you need to understand the fundamental metrics they present. These aren’t just abstract figures; they are direct indicators of your campaign’s health and effectiveness.
Open Rate: Your First Impression Scorecard
The open rate tells you the percentage of recipients who opened your email. It’s the very first hurdle your email needs to clear. A high open rate suggests your subject lines are compelling, your sender name is recognizable and trusted, and your preheader text is intriguing. A low open rate, conversely, signals a problem with one or more of these elements. You should be constantly A/B testing different subject lines to see what performs best with your audience. Consider personalizing subject lines, using emojis strategically, and creating a sense of urgency or curiosity. Furthermore, ensure your sender name is consistent and clearly identifies your brand. If people don’t recognize who the email is from, they’re less likely to open it.
Click-Through Rate (CTR): Gauging Engagement Beyond the Open
While open rate is crucial, the click-through rate (CTR) is arguably an even more powerful metric. It measures the percentage of recipients who clicked on at least one link within your email. A high CTR indicates that your email content is relevant, your call-to-action (CTA) is clear and prominent, and your offer is appealing. A low CTR, even with a good open rate, suggests your content isn’t inspiring action. You need to analyze the design of your email: Is the CTA above the fold? Is it visually distinct? Is the text on the button clear and concise? Also, critically evaluate the value proposition of your offer. Are you asking your subscribers to do something that genuinely benefits them? Testing different CTA placements, button colors, and link text can significantly impact your CTR.
Conversion Rate: The Ultimate Measure of Success
For many email campaigns, the ultimate goal is a conversion – whether that’s a purchase, a sign-up, a download, or a lead submission. The conversion rate measures the percentage of recipients who completed your desired action after clicking through your email. This metric directly ties your email efforts to your business objectives. A strong conversion rate means your entire email funnel, from subject line to landing page, is optimized. If your CTR is high but your conversion rate is low, the problem likely lies with your landing page or the offer itself. Is the landing page congruent with the email’s message? Is it easy to navigate? Is the checkout process smooth? Analyzing your conversion rate requires a holistic view of the user journey.
Bounce Rate: Identifying Deliverability Issues
The bounce rate indicates the percentage of emails that couldn’t be delivered to the recipient’s inbox. There are two main types of bounces: soft bounces (temporary issues like a full inbox) and hard bounces (permanent issues like an invalid email address). A high bounce rate suggests problems with your email list hygiene. Hard bounces, in particular, need immediate attention as they can harm your sender reputation and lead to your emails being flagged as spam. Regularly cleaning your email list to remove invalid addresses is paramount. This can involve using email validation tools and implementing double opt-in processes.
Unsubscribe Rate: Understanding Audience Disengagement
While it might sting, the unsubscribe rate is a valuable metric. It tells you the percentage of recipients who opted out of your email list. A high unsubscribe rate indicates that your content is no longer relevant to a segment of your audience, or perhaps you’re sending emails too frequently. While you can’t please everyone, an unusually high unsubscribe rate warrants a deeper investigation. Are you segmenting effectively? Is your content consistently delivering value? Are you managing send frequency appropriately? Sometimes, offering preference centers where subscribers can choose what type of content they receive can help reduce unsubscribes.
Spam Complaint Rate: A Critical Warning Sign
The spam complaint rate measures the percentage of recipients who marked your email as spam. This is a critical metric to monitor closely. Even a small number of spam complaints can severely damage your sender reputation, leading to lower deliverability across all your campaigns. High spam complaint rates often stem from misleading subject lines, irrelevant content, or sending emails to purchased lists (which is generally a bad practice). Always ensure your content is transparent and that recipients have genuinely opted in to receive your communications.
Leveraging Reports for Strategic Audience Insights
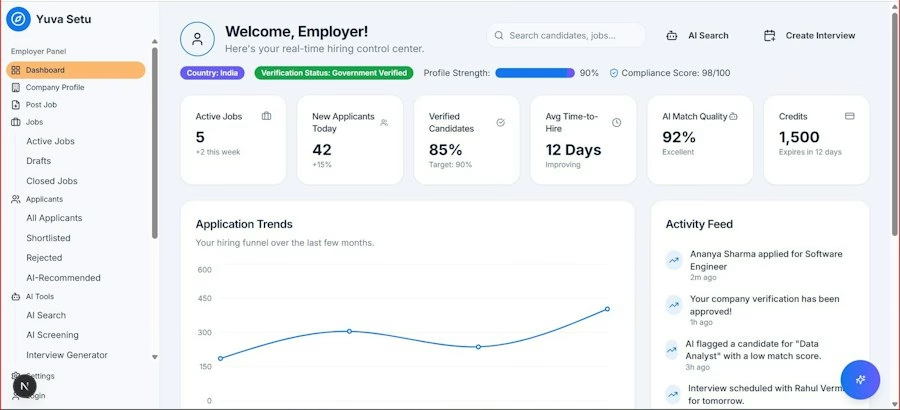
Your email campaign reports aren’t just about how well your emails perform; they are a window into your audience’s preferences and behaviors. By meticulously analyzing the data, you can refine your understanding of who your subscribers are and what they truly want.
Refining Segmentation Based on Engagement
Imagine you send a campaign about product updates to your entire list. Your report shows that customers who purchased Product A have a significantly higher open and click-through rate than those who purchased Product B. This insight is gold. It tells you that your product update emails should be segmented more granularly. You might create separate campaigns tailored specifically to owners of Product A, highlighting features relevant to them, and a different one for Product B owners. This level of segmentation, driven by report data, drastically improves relevancy and engagement. Similarly, if you notice certain demographics or geographical segments consistently show higher engagement with particular content types, you can adjust your future campaigns to cater to those preferences.
Understanding Content Preferences Through Click Behavior
Beyond overall CTR, dive into which specific links within your emails get the most clicks. Are people more interested in blog posts, product pages, tutorials, or special offers? If your report consistently shows high clicks on blog post links but low clicks on product pages, it suggests your audience values educational content more than direct sales pitches within the email itself. You might then adjust your content strategy to include more valuable, informational content, perhaps with soft CTAs that lead to product exploration. Conversely, if discount links always outperform, you know your audience is price-sensitive and responds well to promotions. This granular click data allows you to optimize the balance and type of content you include in your emails.
Optimizing Send Times and Frequency
Your reports provide crucial data about when your audience is most active. By analyzing open and click rates across different send times, you can identify optimal windows. For instance, you might discover that emails sent on Tuesday mornings have significantly higher engagement than those sent on Friday afternoons. This insight allows you to schedule your campaigns for maximum impact. Similarly, monitoring unsubscribe and spam complaint rates in relation to your send frequency helps you find the sweet spot. If unsubscribes spike after sending daily emails, it’s a clear signal you’re overwhelming your audience. You might then reduce frequency to a few times a week, or even once a week, depending on your audience’s tolerance and your content pipeline.
Identifying Technical Issues and Improving Deliverability
High bounce rates and spam complaints are immediate red flags that warrant investigation. Your reports will highlight these issues. A sudden spike in hard bounces could indicate a problem with your list acquisition methods or an old, uncleaned list. A consistent stream of spam complaints points to content or sending practices that are irritating your subscribers or being flagged by email service providers (ESPs). By actively monitoring these metrics, you can quickly address underlying technical issues, such as IP reputation problems, authentication failures (SPF, DKIM, DMARC), or even being blacklisted. Proactive deliverability management, guided by your reports, ensures your carefully crafted emails actually reach their intended destination.
Refining Campaign Strategy with A/B Testing
Email campaign reports are the backbone of effective A/B testing. Without the ability to measure the impact of your changes, A/B testing is meaningless. These reports allow you to systematically experiment and learn what truly resonates with your audience.
Testing Subject Lines and Preheader Text
As mentioned earlier, your open rate is heavily influenced by your subject line and preheader text. A/B testing these elements is one of the easiest and most impactful ways to improve your campaign performance. Create two versions of your subject line, perhaps one that’s direct and another that’s more mysterious or uses an emoji. Send each version to a statistically significant segment of your audience, and then compare the open rates in your reports. The winning subject line becomes the default for the rest of your audience or for future campaigns. Over time, this iterative testing process will reveal patterns about what types of subject lines your audience prefers, leading to consistently higher open rates.
Experimenting with Email Content and Layout
Beyond the subject line, you can A/B test almost every aspect of your email’s content and design. Do your subscribers prefer short, punchy emails or longer, more detailed ones? Do embedded videos increase engagement more than static images? Does a minimalist design outperform a more visually rich layout? By creating two versions of your email with a single variable changed (e.g., different image placements, different headline sizes, different body copy length), sending them to segmented groups, and then comparing their CTRs and conversion rates in your reports, you can gain invaluable insights into your audience’s preferences. This helps you build a library of best practices for your email design.
Optimizing Calls to Action (CTAs)
Your CTA is arguably the most important element for driving conversions. A/B testing your CTAs can yield significant improvements. Experiment with different CTA text (“Shop Now” vs. “Explore the Collection”), button colors, button sizes, and even placement within the email. Does a CTA above the fold perform better than one at the bottom? Is a brightly colored button more effective than a subtle link? Your reports will provide the data to answer these questions. A higher CTR on your CTA, driven by effective A/B testing, directly translates to more conversions and a better return on your email marketing investment.
Discovering Optimal Offer Types
Email is a powerful channel for promoting offers, discounts, and exclusive content. But what kind of offer resonates most with your audience? A/B test different promotions: “10% off your next purchase” vs. “Free shipping on orders over $50” vs. “Buy One Get One Free.” Track the conversion rates for each offer in your reports. You might discover that your audience is more motivated by a percentage discount than free shipping, or vice-versa. This insight allows you to craft future promotions that are highly targeted and more likely to drive sales or desired actions.
Understanding how email campaign reports support better marketing decisions is crucial for any business looking to enhance its outreach strategies. By analyzing these reports, marketers can identify trends and preferences among their audience, leading to more effective campaigns. For those interested in further exploring the nuances of audience targeting, a related article discusses the evolution of list segmentation and how predictive behavior will shape marketing efforts in the coming years. This insight can help marketers refine their strategies and improve overall engagement.
Measuring ROI and Demonstrating Value
| Metric | Description | How It Supports Better Marketing Decisions |
|---|---|---|
| Open Rate | Percentage of recipients who open the email | Helps determine the effectiveness of subject lines and optimal send times |
| Click-Through Rate (CTR) | Percentage of recipients who clicked on links within the email | Measures engagement and helps optimize content and call-to-action placement |
| Conversion Rate | Percentage of recipients who completed a desired action after clicking | Assesses campaign ROI and effectiveness of landing pages and offers |
| Bounce Rate | Percentage of emails that could not be delivered | Indicates list quality and helps maintain sender reputation by cleaning lists |
| Unsubscribe Rate | Percentage of recipients who opt out from future emails | Signals content relevance and frequency issues, guiding content strategy adjustments |
| Spam Complaint Rate | Percentage of recipients marking the email as spam | Helps identify targeting or content problems to avoid deliverability issues |
| List Growth Rate | Rate at which the email subscriber list is growing | Measures effectiveness of lead generation and audience expansion efforts |
| Forward/Share Rate | Percentage of recipients who share the email with others | Indicates content value and potential for organic reach and brand advocacy |
Ultimately, marketing decisions are about generating measurable results. Email campaign reports are your most powerful tool for calculating Return on Investment (ROI) and demonstrating the tangible value your email efforts bring to the business.
Connecting Email Performance to Business Outcomes
Every email campaign should have a clear objective: drive sales, generate leads, increase website traffic, or build brand awareness. Your reports allow you to directly connect email performance to these business outcomes. For an e-commerce business, tracking conversion rates from email clicks to actual purchases is straightforward. For a lead generation campaign, monitoring the number of form submissions originating from your emails directly shows your impact. By clearly defining these connections, you can articulate the financial contribution of your email marketing strategy. This moves email marketing from a nebulous activity to a quantifiable driver of revenue.
Calculating Your Return on Investment (ROI)
The ability to calculate ROI is perhaps the most compelling reason to diligently analyze your email reports. You can quantify the revenue generated directly from your email campaigns and compare it to the cost of your email marketing efforts (platform fees, content creation, staff time). For example, if a campaign costs $100 to execute and generates $1000 in sales, your ROI is a very healthy 900%. By consistently tracking ROI, you can justify your marketing budget, secure more resources, and continuously optimize your campaigns to maximize profitability. This data-driven approach positions email marketing as a strategic asset rather than a mere expense.
Demonstrating Value to Stakeholders
When presenting to senior management or other stakeholders, anecdotal evidence won’t cut it. They want to see numbers. Your email campaign reports provide the hard data needed to demonstrate the effectiveness of your efforts. You can showcase improvements in open rates, CTRs, and most importantly, conversion rates and ROI over time. Highlighting successful A/B tests and the resulting uplift in performance illustrates a strategic, data-driven approach. This builds trust, reinforces the value of email marketing, and helps secure buy-in for future initiatives. Being able to clearly articulate the revenue generated or leads acquired directly from email campaigns solidifies your position as a valuable contributor to the company’s bottom line.
Understanding how email campaign reports can enhance marketing decisions is crucial for any business looking to optimize its outreach. For those interested in diving deeper into the intersection of data and marketing strategy, a related article discusses the importance of combining purchase history and engagement data to maximize conversions. You can read more about this insightful approach in the article here. By leveraging these insights, marketers can create more targeted and effective campaigns that resonate with their audience.
Continuous Improvement Through Iterative Analysis
Email marketing is not a set-it-and-forget-it endeavor. It’s a dynamic process of continuous learning and adaptation. Your campaign reports are the engine of this iterative improvement cycle.
Establishing Benchmarks and Tracking Progress
Initially, your reports will help you establish baseline performance metrics. What are your average open rates, CTRs, and conversion rates? These become your benchmarks. Going forward, you can then track your progress against these benchmarks. Are your new campaigns performing better or worse than average? Identifying trends over time is crucial. For example, if you notice a gradual decline in open rates across all campaigns, it might indicate a broader issue with sender reputation or audience fatigue that needs to be addressed. Conversely, a consistent improvement in CTRs after implementing A/B test learnings indicates a successful refinement of your strategy.
Identifying Areas for Future Optimization
Every report provides clues for future optimization. A low open rate on a specific campaign signals a need to rework subject lines. A high CTR but low conversion rate points to issues with your landing page or the offer itself. A sudden spike in unsubscribes might warrant an audit of your content strategy or send frequency. By systematically reviewing your reports, you can pinpoint weaknesses and develop targeted strategies to address them. This proactive approach prevents small issues from escalating into major problems and ensures your email marketing efforts are always moving in the right direction.
Adapting to Evolving Audience Behavior and Market Trends
Your audience isn’t static, and neither is the market. New technologies emerge, consumer preferences shift, and competitor strategies evolve. Your email campaign reports help you stay attuned to these changes. For instance, a sudden increase in mobile opens and clicks could signal a need to further optimize your emails for mobile responsiveness. A change in the types of content your audience engages with (e.g., more interest in video content, less in long-form articles) should inform your content strategy. By continuously analyzing your reports, you can adapt your email marketing strategy to remain relevant, effective, and ahead of the curve, ensuring your messages always resonate with your evolving audience. This agile approach, driven by data, is what separates successful email marketers from those who simply send emails into the void.
FAQs
1. How do email campaign reports help in measuring the success of marketing efforts?
Email campaign reports provide valuable metrics such as open rates, click-through rates, conversion rates, and bounce rates, which help marketers gauge the effectiveness of their email campaigns. By analyzing these metrics, marketers can understand what is working well and what needs improvement.
2. What insights can be gained from email campaign reports?
Email campaign reports offer insights into subscriber behavior, such as which links are being clicked, which content is resonating with the audience, and which subject lines are driving engagement. Marketers can use this information to optimize future campaigns and tailor content to better meet the needs of their audience.
3. How do email campaign reports help in segmenting the audience?
Email campaign reports allow marketers to segment their audience based on various criteria such as engagement levels, demographics, and past purchase behavior. By segmenting the audience, marketers can send more targeted and personalized emails, leading to higher engagement and conversion rates.
4. How can email campaign reports help in A/B testing?
Email campaign reports enable marketers to conduct A/B tests by comparing the performance of different email elements, such as subject lines, call-to-action buttons, and images. By analyzing the results of A/B tests through email campaign reports, marketers can identify the most effective strategies and optimize future campaigns accordingly.
5. How do email campaign reports support data-driven decision-making?
Email campaign reports provide marketers with data and insights that can guide decision-making processes. By relying on data from email campaign reports, marketers can make informed decisions about content strategy, audience segmentation, and campaign optimization, ultimately leading to more successful marketing efforts.