



Unveiling the Inbox Narrative
Your email reports are far more than just dry statistics; they are a rich tapestry of data woven from the actions and inactions of your subscribers. Each open, click, unsubscribe, and even unread email tells a story, offering profound insights into the minds and motivations of the people you’re trying to reach. By delving deep into these reports, you unlock the ability to not only understand what’s working and what’s not, but also to predict future behavior, personalize your communication, and ultimately, cultivate a more engaged and valuable subscriber base. Forget simply sending emails; you’re now engaging in a continuous dialogue, and your reports are the transcript of that conversation, waiting to be deciphered.
Decoding Open Rates: Beyond the First Glance
The open rate is often the first metric people look at, and while it’s a crucial indicator of subject line effectiveness and sender recognition, its true value lies in the nuances. A high open rate suggests your subject lines are compelling and your audience trusts your sender name. However, a consistently low open rate signals a potential problem with your subject line strategy, your sender reputation, or even the relevance of your content to your audience. But don’t stop there. Segmenting your open rates by audience demographics, send time, and even day of the week can reveal patterns you might otherwise miss. For instance, you might find that subscribers in a particular time zone open emails more frequently in the evenings, or that a specific demographic responds better to question-based subject lines. Furthermore, consider the trend of your open rates over time. Are they increasing, decreasing, or stagnating? This trend analysis is vital for identifying long-term shifts in subscriber engagement.
The Power of Click-Through Rates: Gauging Content Resonance
While an open indicates initial interest, a click-through signifies genuine engagement with your content. Your click-through rate (CTR) is arguably one of the most important metrics, as it directly reflects how compelling and relevant your email’s body content is, and how effective your calls to action (CTAs) are. A high CTR means your message resonated, your offer was appealing, and your links were easy to find and understand. Conversely, a low CTR can point to several issues: your content might not be relevant to your audience, your CTAs might be unclear or unappealing, or your email design could be hindering usability. Analyzing which specific links are clicked most frequently within your emails provides invaluable insight into what content or offers your subscribers find most valuable. Are they clicking on product links, blog articles, social media buttons, or contact information? This information directly informs future content creation and offer development.
Understanding Unsubscribe Rates: A Call to Action for Improvement
No one likes to see unsubscribes, but they are an inevitable part of email marketing. Rather than viewing them as failures, see them as direct feedback from your audience. A high unsubscribe rate can be a clear warning sign that something is amiss. It could indicate that you’re emailing too frequently, your content is no longer relevant to a segment of your audience, your initial acquisition strategy brought in uninterested subscribers, or your segmentation is ineffective. However, a low and steady unsubscribe rate is generally healthy; it indicates that your list is self-cleaning, removing those who are no longer interested, thus improving the overall engagement metrics of your remaining subscribers. What’s crucial is to track the reasons for unsubscribing, if your email service provider offers this feature. Are they finding your emails irrelevant, too frequent, or just not what they expected? This direct feedback is gold for refining your strategy.
Understanding subscriber behavior through email reports is crucial for optimizing your email marketing strategy. For a deeper dive into the limitations of relying solely on email metrics, you may find the article “Are You Missing 90% of Your Data? Why Email-Only Metrics Aren’t Enough” particularly insightful. It discusses the importance of integrating additional data sources to gain a comprehensive view of your audience’s engagement. You can read the article [here](https://blog.smartmails.io/2025/11/10/are-you-missing-90-of-your-data-why-email-only-metrics-arent-enough/).
Advanced Behavioral Analysis Through Reporting
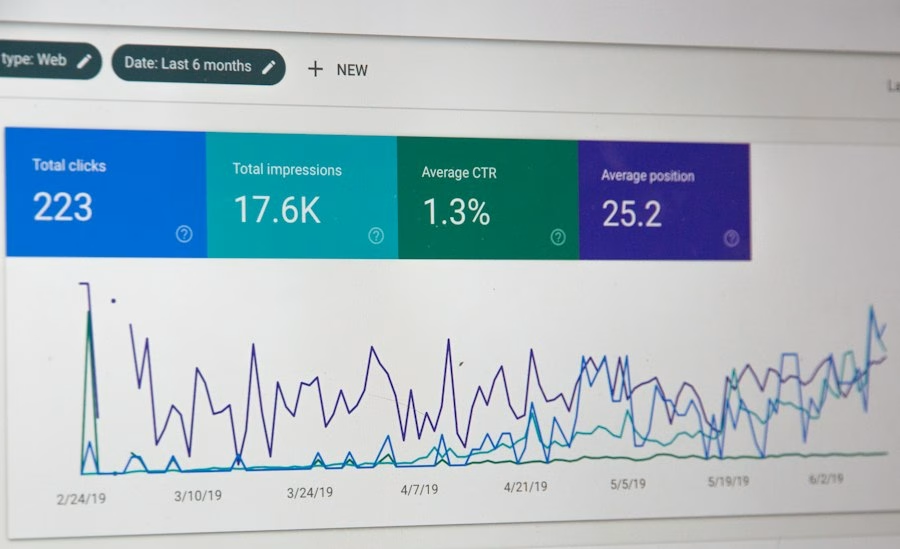
Moving beyond the surface-level metrics, email reports offer a deeper dive into behavioral patterns that can transform your understanding of your audience. This advanced analysis moves beyond individual email performance to paint a broader picture of subscriber journeys and preferences.
Segmentation by Engagement Levels: Identifying Your Most Valuable Subscribers
Not all subscribers are created equal. Your reports allow you to segment your audience based on their engagement levels. You can identify your “super-engagers” – those who consistently open and click, perhaps even convert. These are your most loyal and valuable subscribers, and they often deserve special treatment, such as exclusive content or early access to promotions. Conversely, you can identify “dormant” or “inactive” subscribers – those who haven’t opened or clicked in a significant period. These subscribers might need a re-engagement campaign, or perhaps it’s time to consider removing them from your active list to maintain list hygiene and improve overall deliverability. Creating these segments allows you to tailor your communication strategy, sending highly relevant content to each group, increasing engagement and conversion rates across the board.
Time of Day and Day of Week Performance: Optimizing Send Schedules
Your reports will show you when your subscribers are most receptive. By analyzing open and click-through rates by the time of day and day of the week, you can pinpoint optimal send times. For some audiences, early mornings might be best, while for others, evenings or weekends could yield higher engagement. This isn’t a one-size-fits-all metric; it varies significantly based on your industry, target audience demographics, and even geographical location. A B2B audience, for example, might be more engaged during business hours, whereas a B2C audience might interact more on their commutes or during leisure time. A/B testing different send times is a powerful way to leverage this data and continually refine your schedule for maximum impact.
Device Usage Trends: Tailoring Your Email Design
With the proliferation of smartphones and tablets, understanding how your subscribers consume your emails is paramount. Your reports can often reveal the percentage of opens and clicks coming from mobile devices versus desktop computers. If a significant portion of your audience is opening on mobile, it’s a clear signal that your emails absolutely must be mobile-responsive. This means concise subject lines, larger fonts, clear calls to action, and vertically stacked layouts are crucial for an optimal viewing experience. Ignoring device usage trends can lead to a frustrating experience for your subscribers, resulting in lower engagement and higher unsubscribe rates. This data also influences decisions about image heavy emails versus text heavy emails, considering data usage and loading times on mobile networks.
Understanding the Customer Journey Through Email Interactions
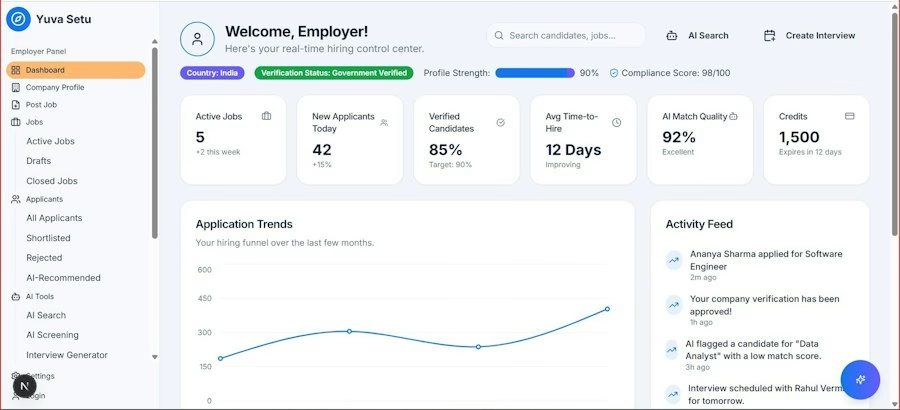
Your email reports don’t just tell you about individual email performance; they piece together a narrative of your subscribers’ journeys with your brand. Each interaction, or lack thereof, contributes to this larger story, offering insights into their evolving needs and interests.
Tracking Conversions: From Click to Customer
The ultimate goal for many email campaigns is conversion – a purchase, a download, a signup, or a lead generation. Integrating your email platform with your analytics tools (like Google Analytics) allows you to track the entire conversion funnel, from the initial email open and click, all the way to the final conversion event on your website. This provides a clear ROI for your email efforts. You can identify which specific email campaigns drive the most conversions, which CTAs are most effective, and which segments of your audience are most likely to convert. This data is invaluable for optimizing your entire marketing strategy, allowing you to allocate resources to the campaigns that deliver the best results.
Purchase History and Email Engagement: A Symbiotic Relationship
For e-commerce businesses, linking email engagement data with purchase history offers incredibly powerful insights. You can identify customers who consistently open and click but rarely purchase, suggesting a need for more compelling offers or a stronger value proposition. Conversely, you can pinpoint customers who have made multiple purchases but show declining email engagement, indicating a potential churn risk that could be addressed with targeted re-engagement campaigns. This integration allows for highly personalized email marketing, such as sending product recommendations based on past purchases or browsing behavior, or offering loyalty rewards to high-value customers. It also helps in understanding the lifetime value (LTV) of customers acquired through email.
Content Preferences: What Resonates Most?
By analyzing click-through rates on different types of content within your emails, you can discern your subscribers’ content preferences. Do they click more on blog posts, product showcases, video links, or whitepapers? This insight directly informs your content strategy, ensuring you’re creating and sharing the types of content your audience genuinely wants to consume. If your subscribers consistently click on educational content, you know to prioritize informative articles and guides. If they’re drawn to promotional offers, you can fine-tune your sales messaging. This continuous feedback loop ensures your content remains relevant and valuable, fostering deeper engagement.
Identifying and Addressing Deliverability Concerns
Even the most perfectly crafted email will fail if it doesn’t reach the inbox. Your email reports provide critical indicators of your deliverability health, allowing you to proactively address issues before they significantly impact your reach.
Bounce Rates: Hard vs. Soft Bounces
Bounce rates are a crucial indicator of list health. There are two main types:
- Hard Bounces: These indicate a permanent delivery failure, usually because the email address is invalid, doesn’t exist, or has been permanently blocked. A high hard bounce rate signals significant list hygiene issues, often from purchasing lists or using outdated data. Your email service provider will typically automatically remove hard-bounced addresses from your list to protect your sender reputation.
- Soft Bounces: These are temporary delivery failures, perhaps due to a full inbox, a server being temporarily down, or the message being too large. Your ESP will usually retry sending these emails for a period. A high soft bounce rate could indicate issues with your content (e.g., triggering spam filters) or a temporary problem with the recipient’s mail server.
Monitoring both types of bounces is essential. A sudden spike in either warrants investigation. High bounce rates can negatively impact your sender reputation, making it harder for your emails to reach the inbox in the future.
Spam Complaints: The Ultimate Warning Sign
Spam complaints are perhaps the most damaging metric for your sender reputation. When a subscriber marks your email as spam, it sends a strong negative signal to internet service providers (ISPs). A consistently high spam complaint rate will lead to your emails being directed to spam folders or even outright blocked. If you see an increase in spam complaints, it’s a critical alarm bell. It could mean your content is irrelevant, your subscribers didn’t opt-in willingly, or your emails are too frequent. Addressing the root cause immediately is paramount to avoid long-term damage to your deliverability. Review your opt-in processes, email frequency, and content relevance.
List Hygiene and Inactive Subscribers: Maintaining a Healthy Ecosystem
Your reports reveal patterns of inactivity. Subscribers who consistently don’t open or click, despite numerous attempts, become a liability to your sender reputation. ISPs look at engagement rates as a key factor in determining whether your emails are welcomed or unwanted. Sending to a large segment of unengaged subscribers tells ISPs that your emails aren’t valued, increasing the likelihood of future emails landing in the spam folder, even for your engaged subscribers. Therefore, actively managing inactive subscribers is crucial. This might involve re-engagement campaigns to win them back, or strategically segmenting them off your main mailing list, or even purging them entirely if re-engagement efforts fail. Regularly cleaning your list by removing invalid or chronically unengaged addresses is a proactive measure that pays dividends in improved deliverability and overall engagement.
Understanding subscriber behavior through email reports is crucial for enhancing engagement and conversion rates. For those looking to delve deeper into optimizing their email strategies, a related article discusses the importance of post-click A/B testing and how it can significantly impact conversion outcomes. You can read more about it in this insightful piece on optimizing conversions. This approach complements the analysis of email reports by focusing on what happens after the click, providing a comprehensive view of subscriber interactions.
Strategic Iteration and Growth Based on Report Insights
| Metric | Description | What It Tells You About Subscriber Behavior |
|---|---|---|
| Open Rate | Percentage of recipients who open your email | Indicates how compelling your subject line and sender name are to subscribers |
| Click-Through Rate (CTR) | Percentage of recipients who clicked on links within the email | Shows engagement level and interest in the email content or offers |
| Bounce Rate | Percentage of emails that could not be delivered | Reflects list quality and helps identify invalid or inactive email addresses |
| Unsubscribe Rate | Percentage of recipients who opt out from future emails | Indicates dissatisfaction or irrelevance of content to subscribers |
| Spam Complaint Rate | Percentage of recipients marking your email as spam | Signals potential issues with email relevance or frequency |
| Conversion Rate | Percentage of recipients completing a desired action (purchase, signup) | Measures effectiveness of email in driving subscriber actions |
| Forward/Share Rate | Percentage of recipients who share or forward the email | Indicates content value and likelihood of organic growth |
| Device and Email Client Usage | Data on what devices and email clients subscribers use | Helps optimize email design and formatting for subscriber preferences |
The true power of email reports lies not just in understanding the data, but in using that understanding to inform continuous improvement and strategic growth. This involves a cyclical process of analysis, adaptation, and testing.
A/B Testing: Data-Driven Optimization
Your reports provide the perfect foundation for A/B testing. Based on your insights, you can hypothesize changes and test them rigorously. Did your open rates suggest your subject lines could be improved? A/B test different subject line formats, lengths, or use of emojis. Did your CTR indicate a need for clearer CTAs? A/B test different CTA button designs, wording, or placement. Are certain segments responding better to specific content types? A/B test variations of your email content tailored to those segments. A/B testing allows you to systematically optimize every element of your email campaigns, providing concrete data to back up your decisions and ensuring that every change you make is moving you closer to your goals. It’s a continuous process of refinement, leading to incrementally better results over time.
Personalization and Automation: Leveraging Data for Tailored Experiences
The insights gleaned from your reports are the bedrock of effective personalization and automation. Knowing what content a subscriber clicks on, what products they view, or when they last purchased allows you to send highly relevant, automated emails. If a subscriber repeatedly clicks on articles about “sustainable living,” you can set up an automation to send them more content on that topic. If they abandon a shopping cart, a triggered email can remind them of their items. This level of personalization, driven by their past behavior reflected in your reports, dramatically increases engagement and conversion rates, making your subscribers feel understood and valued. It transforms mass communication into a series of one-on-one conversations.
Continuous Learning and Adaptation: The Evolving Subscriber
Subscriber behavior is not static. Trends change, preferences shift, and your audience evolves. Therefore, your approach to analyzing email reports should also be continuous and adaptive. What worked last year might not work today. Regularly review your historical data to identify long-term trends and anticipate future shifts. Are your subscribers engaging more with video content? Are they preferring shorter, punchier emails over long-form newsletters? By staying attuned to these evolving behaviors, you can proactively adjust your strategy, ensuring your email program remains relevant, effective, and a powerful engine for building strong relationships and achieving your business objectives. The reports are your compass, guiding you through the dynamic landscape of subscriber engagement.
FAQs
What are email reports?
Email reports are analytical documents that provide insights into the performance of email marketing campaigns. They typically include metrics such as open rates, click-through rates, bounce rates, and unsubscribe rates, helping marketers understand how subscribers interact with their emails.
How can email reports help understand subscriber behavior?
Email reports can reveal patterns in subscriber engagement, such as which types of content are most appealing, the best times to send emails, and how often subscribers engage with the content. By analyzing these metrics, marketers can tailor their strategies to better meet the preferences of their audience.
What metrics are most important in email reports?
Key metrics in email reports include open rates, which indicate how many subscribers opened the email; click-through rates, which show how many clicked on links within the email; conversion rates, which measure the percentage of subscribers who completed a desired action; and unsubscribe rates, which indicate how many opted out of future communications.
How often should email reports be generated?
Email reports should ideally be generated after each campaign to assess immediate performance. Additionally, regular weekly or monthly reports can help track trends over time, allowing marketers to adjust their strategies based on long-term subscriber behavior.
What actions can be taken based on email report insights?
Based on insights from email reports, marketers can optimize their email content, adjust sending times, segment their audience for targeted campaigns, and refine their overall email marketing strategy to improve engagement and reduce unsubscribe rates.