



You’re sitting in your office, the hum of the server a familiar comfort. You’ve just launched a new broadcast, or perhaps you’re reviewing the performance of a long-running series. The question gnaws at you: are you truly connecting with your audience? Are you giving them what they want, or what you think they want? This is where the power of broadcast statistics becomes your most invaluable ally, not just as a manager or creator, but as a detective. You’re not just looking at numbers; you’re piecing together clues, decoding behaviors, and ultimately, transforming raw data into actionable insights that will shape your future content decisions.
You stand at the frontier of understanding. Today’s broadcasting landscape is a rich tapestry of data, meticulously woven by every interaction your audience has with your content. This isn’t just about raw viewership figures anymore. It’s about the granular details that reveal the “why” behind the numbers. Your broadcast stats are a living, breathing testament to your audience’s habits, preferences, and evolving tastes. Your first task is to lay out a robust framework for collecting and interpreting this wealth of information.
Identifying Your Key Performance Indicators (KPIs)
Before you can uncover anything, you need to define what success looks like. For you, this means identifying the crucial metrics that truly matter for your broadcast. Are you focused on pure reach, aiming to expose your content to as many eyes as possible? Or is engagement the holy grail, measuring how deeply your audience connects with what you’re presenting? Perhaps retention is paramount, indicating that viewers are not just starting your content, but finishing it.
Reach and Impressions: Who is Seeing What?
Your most basic measure of success is understanding how many people are actually encountering your broadcast. You’ll look at metrics like raw viewership numbers, unique viewers, and total impressions. This tells you the sheer scale of your audience. Are you reaching a niche segment effectively, or are you struggling to break through the noise? Analyze trends over time. Did a particular episode or promotion lead to a significant spike in reach? Understanding these peaks and troughs is the first step in correlating external factors with audience acquisition.
Engagement Metrics: Beyond Just Watching
True understanding goes beyond passive viewing. You need to delve into how your audience is interacting with your content. This is where engagement metrics shine.
Click-Through Rates (CTR) for Interactive Elements
If your broadcast incorporates interactive elements, such as polls, quizzes, or links to further information, your CTR on these becomes a vital indicator. A high CTR suggests that your audience is not only watching but also actively seeking to participate or learn more. Conversely, a low CTR might signal that the interactive elements are not compelling enough, or perhaps poorly placed. You’ll want to analyze which calls to action are most effective. Is it a question posed directly to the audience, a link to a companion resource, or a prompt for social media interaction?
Average View Duration and Completion Rates
How long are people actually watching? Your average view duration is a powerful indicator of how captivating your content is. Are viewers tuning in for the entire broadcast, or are they dropping off after a few minutes? This is where completion rates become critical. A high completion rate for a specific segment or the entire broadcast suggests that you’ve successfully held their attention. Conversely, sharp drops at particular points in your content might pinpoint areas that are less engaging, perhaps too slow-paced, or lacking in compelling narrative.
Social Media Shares, Likes, and Comments
The conversation around your broadcast extending beyond your platform is a goldmine of qualitative data. You’ll monitor social media mentions, hashtags, likes, shares, and comments. This isn’t just about vanity metrics; it’s about understanding the buzz you’re generating. Are people actively discussing your content, sharing their favorite moments, or debating key points? This qualitative feedback, though less structured than quantitative data, can offer profound insights into what resonates and what falls flat.
Audience Segmentation: Understanding the Different Flavors of Your Viewers
You’re not catering to a monolithic entity. Your audience is a diverse group with varying interests, demographics, and viewing habits. Your ability to segment this audience allows you to tailor content more effectively and understand which groups are most receptive to what you’re offering. This is where a deeper level of analysis begins.
Demographic Breakdown: Age, Location, Gender, and Beyond
Understanding the basic demographic makeup of your audience is foundational. Are you reaching the age groups you intended? Is your content resonating more strongly in certain geographic regions? While gender is still a relevant factor, don’t stop there. Consider other demographic data that might be available through your platform analytics, such as income levels or education, if relevant to your broadcast’s subject matter. This helps you paint a richer picture of who is watching.
Psychographic Profiling: Interests, Values, and Lifestyles
Beyond demographics, understanding the psychographics of your audience is crucial for truly connecting with them. What are their interests, their values, their lifestyles? This information might not be directly available in basic broadcast stats, but you can infer it through their viewing patterns. For example, if your broadcast covers a broad topic, and you see a significant portion of your audience also watches documentaries on historical events, you can infer a shared interest in history. You might also correlate viewing habits with external data if you have access to user surveys or other forms of audience research.
In exploring the intricacies of audience engagement, the article “How Broadcast Stats Reveal What Your Audience Really Wants” provides valuable insights into understanding viewer preferences through data analysis. For those interested in further enhancing their data-driven strategies, a related article titled “Data Mapping 101: Perfectly Matching Custom Fields on Import” offers essential guidance on optimizing data management processes. You can read it here: Data Mapping 101. This resource complements the discussion by highlighting the importance of accurate data mapping in tailoring content to meet audience needs effectively.
Analyzing Viewing Habits: The Rhythms of Consumption
Once you’ve established your foundational metrics and begun to segment your audience, you need to dive into the nitty-gritty of how they consume your content. This is where you uncover the subtle rhythms that dictate their engagement.
Peak Viewing Times and Days: When is Your Audience Most Active?
Every audience has its prime time. By analyzing your broadcast stats, you can identify the days of the week and the times of day when your viewership is consistently highest. This isn’t just about scheduling new content; it’s about understanding your audience’s lifestyle and when they have the most leisure time to dedicate to your broadcast.
Identifying Day-Part Peaks
Are your viewers tuning in during prime evening hours, or are they catching up on weekends? You’ll want to create detailed charts and graphs to visualize these peaks. Look for consistent patterns rather than one-off anomalies. This data can inform your decision on when to premiere new episodes, when to run special live events, and when to promote your existing library of content for maximum impact.
Understanding Habitual Viewing Patterns
Beyond just peak times, you might discover habitual viewing patterns. Do viewers tend to watch a certain number of episodes in a single sitting? Do they always tune in for the beginning of a program, or are they more inclined to jump in midway? Understanding these habits can help you structure your content for better binge-watching potential or to ensure that even latecomers can easily acclimate.
Content Consumption Patterns: What Segments Resonate Most?
Within your broadcast, which parts are capturing attention, and which are losing it? This is where you can identify the true stars and the potential underperformers of your content.
Drop-off Points: Where Do Viewers Lose Interest?
This is a critical area for improvement. By meticulously analyzing where viewers exit your broadcast, you can pinpoint specific segments that might be too long, too slow, too technical, or simply not engaging enough. You’ll be looking for sharp declines in viewership at particular timestamps. This allows you to revise those sections in future productions or to consider cutting them altogether.
Highlight Moments: What Captures and Retains Attention?
Conversely, where does your viewership spike or remain consistently high? These are your highlight moments – the segments that truly hook your audience. Is it a captivating interview, a dramatic reveal, a humorous anecdote, or a particularly insightful explanation? Identifying these moments is crucial for replicating success. You can then analyze the elements that contribute to their effectiveness – the pacing, the storytelling, the visuals, the presenter’s delivery – and incorporate those learnings into new content.
Re-watchability and Buffering Data: Indicating Deep Engagement or Technical Issues
If your platform allows for it, analyzing re-watch data can tell you a lot. Are viewers going back to re-watch specific segments? This indicates a high level of engagement and a desire to fully absorb the information or enjoy a particular moment. On the other hand, significant buffering issues can skew your data. While not directly related to content preference, persistent technical problems can lead to viewer frustration and drop-off, so it’s important to distinguish between voluntary re-watching and forced pauses due to poor streaming quality.
Understanding Audience Feedback: The Voice of the Viewer

Statistics offer a powerful lens, but they are not the only source of truth. Your audience is actively expressing their opinions, both directly and indirectly. You must be attuned to their voice.
Direct Feedback Channels: Surveys, Polls, and Comments
You have direct lines of communication with your audience. Utilizing them effectively is paramount.
Post-Broadcast Surveys: Targeted Insights
After a broadcast, or in between them, you can deploy targeted surveys. These are your most direct way of asking your audience what they liked, what they didn’t like, and what they’d like to see next. Keep surveys concise and focused to maximize completion rates. Ask specific questions about content segments, presenters, or topics covered.
In-Broadcast Polls and Q&As: Real-Time Interaction
Interactive polls embedded within your broadcast provide immediate feedback on specific points. Are viewers agreeing with a statement, expressing confusion, or finding a particular segment entertaining? Live Q&A sessions, enabled by your broadcast platform, allow you to address audience questions in real-time, demonstrating responsiveness and gathering valuable insights into what aspects of your content spark curiosity or concern.
Social Media Engagement and Sentiment Analysis
As mentioned earlier, social media is a vibrant forum for discussion. You need to go beyond simply counting likes and shares. Employ sentiment analysis tools or conduct manual reviews to gauge the overall feeling towards your broadcast. Are discussions predominantly positive, negative, or neutral? What specific issues are people raising? Identifying recurring themes in comments can highlight areas of widespread satisfaction or discontent.
Indirect Feedback: Behavior as a Language
Your audience’s actions speak volumes, even without explicit commentary. You need to learn to interpret this silent language.
Subscriber Growth and Churn Rates: The Ultimate Endorsement (or Lack Thereof)
The decision to subscribe, or to unsubscribe, is a powerful statement of preference. Monitor your subscriber growth over time. Did a particular broadcast or series lead to a surge in new subscribers? Conversely, are you experiencing significant churn? Analyze the content that was released leading up to subscriber drops. This correlation can be a stark indicator of what your audience is willing to commit to, and what they’re not.
Website Traffic and Engagement Metrics (Related to Broadcast Content)
If your broadcast drives traffic to your website, or to specific landing pages, this is a key indicator. Are viewers seeking more information, purchasing related products, or engaging with supplementary content after watching? Analyze the referral traffic from your broadcast to your website. What pages are they visiting? How long are they staying? This shows you what aspects of your broadcast have sparked further interest.
Data Visualization and Trend Analysis: Bringing the Numbers to Life
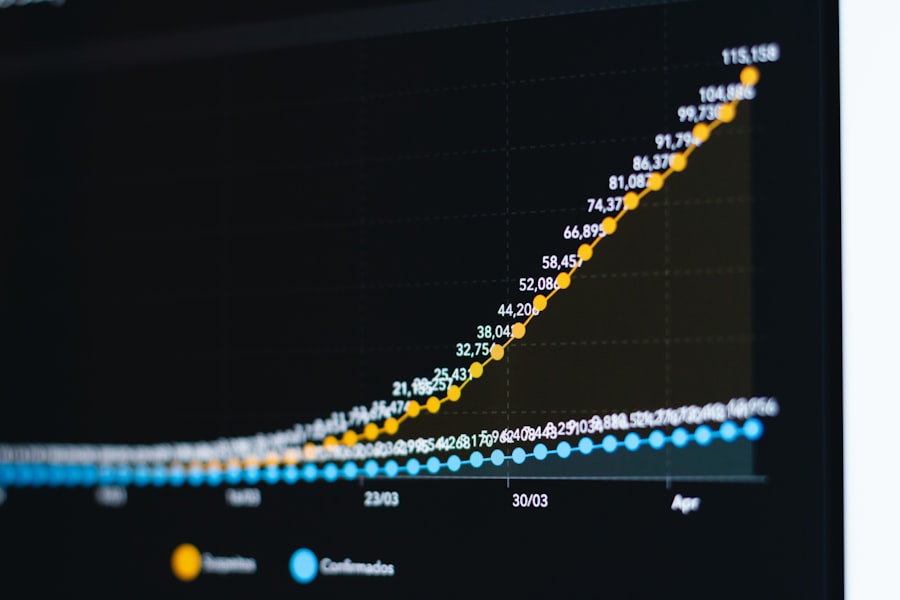

Raw data, while informative, can be overwhelming. Your next critical step is to transform these numbers into digestible and actionable insights.
Creating Informative Dashboards: A Snapshot of Performance
You don’t want to be wading through spreadsheets every time you want to assess your broadcast’s performance. Develop clear, concise dashboards that display your key performance indicators at a glance.
Customizable Dashboards for Different Stakeholders
Different people within your organization will have different needs. A content producer might be interested in drop-off points, while a marketing manager might focus on reach and subscriber growth. Create customizable dashboards that cater to these varied needs. This ensures that everyone has access to the most relevant information for their role.
Real-Time vs. Historical Data Views
Your dashboard should offer both real-time performance data and historical trends. Seeing how you’re performing now is important for immediate adjustments, but understanding how you’ve performed over time allows you to identify long-term patterns and the impact of strategic changes.
Identifying Trends and Anomalies: Spotting the Signals
This is where you become a true analyst. You’re not just looking at snapshots; you’re looking for the underlying currents.
Seasonal Trends and Event-Driven Fluctuations
Does your viewership naturally dip during holiday seasons? Do specific industry events or news cycles cause spikes or dips in engagement? Identifying these seasonal or event-driven fluctuations is crucial for context. It helps you differentiate between normal cyclical behavior and genuine shifts in audience preference or interest.
Outlier Detection: What’s Unexpected?
Look for anomalies – data points that deviate significantly from the norm. These outliers can be incredibly insightful. A sudden, unexplained drop in viewership during a normally strong period might indicate a technical issue or a critical failure in content delivery. Conversely, an unexpected surge could signal that you’ve tapped into a new, previously underserved audience segment or that a particular piece of content has gone viral organically. Investigating these anomalies is often where the most valuable discoveries are made.
Understanding your audience’s preferences is crucial for effective communication, and a related article that delves into this topic is available here. By exploring the significance of email newsletters and their best practices, you can gain insights into how to engage your audience more effectively. This article highlights strategies that complement the findings from broadcast statistics, helping you tailor your content to meet the desires of your audience. For more information, check out the article on email newsletters.
Iterative Improvement: The Cycle of Data-Driven Content Creation
| Metrics | Definition |
|---|---|
| Viewership | The number of people who watched a particular broadcast |
| Ratings | The measurement of the audience size for a particular program or time slot |
| Demographics | The characteristics of a specific population, such as age, gender, income, etc. |
| Engagement | The level of interaction and involvement of the audience with the broadcast content |
| Retention | The ability of a broadcast to keep the audience engaged and watching for a longer period of time |
The most successful broadcasters don’t just analyze data; they use it to continuously refine their approach. This is an ongoing cycle of creation, analysis, and iteration.
Implementing Changes Based on Insights: From Data to Action
You have the data; now you need to act on it. This is the culmination of your efforts.
A/B Testing Content Strategies
You might have hypotheses about what will resonate. Use A/B testing to validate these hypotheses. For example, if you suspect a shorter intro will keep viewers engaged, create two versions of your broadcast – one with the original intro and one with a shortened version – and measure their performance. This data-driven approach removes guesswork from content development.
Refining Content Formats and Delivery
Are your viewers clearly preferring short-form video segments over long, drawn-out discussions? If your data shows consistent drop-off during lengthy monologues, consider breaking them down into shorter, more digestible clips. If live Q&As consistently drive high engagement, explore opportunities to incorporate more of them. Your statistics provide the mandate for these format adjustments.
Building a Culture of Data-Informed Decision-Making
This isn’t just about one person or one department. To truly leverage broadcast stats, you need to foster a culture where data is respected, understood, and actively used to guide all content-related decisions.
Education and Training for Your Team
Ensure that everyone involved in content creation understands the basics of broadcast analytics. Provide training on how to access and interpret key metrics. When your team understands the “why” behind the data, they are more empowered to make informed decisions in their day-to-day work.
Regular Reporting and Review Sessions
Establish a regular cadence for reviewing broadcast performance data. This could be weekly, bi-weekly, or monthly. Dedicate time in team meetings to discuss insights, celebrate successes, and identify areas for improvement. This consistent focus ensures that data remains top-of-mind and that action is taken.
Celebrating Data-Driven Successes
When your analysis leads to a tangible improvement in viewership, engagement, or subscriber growth, celebrate it! This reinforces the value of your data-driven approach and encourages continued commitment to understanding your audience. By consistently uncovering what your audience truly prefers, not just guesswork, you’re not just broadcasting; you’re building a resilient, responsive, and ultimately more successful media presence.
FAQs
What are broadcast stats?
Broadcast stats refer to the data and analytics collected from various broadcasting platforms, such as television, radio, and online streaming services. These stats include information on audience viewership, engagement, and demographics.
How do broadcast stats reveal what the audience wants?
Broadcast stats reveal what the audience wants by providing insights into which programs, content, or topics are most popular and engaging. By analyzing viewership patterns, engagement metrics, and audience feedback, broadcasters can understand the preferences and interests of their audience.
What type of information can be gathered from broadcast stats?
Broadcast stats can provide information on audience demographics, viewing habits, program performance, audience engagement, and content preferences. This data can help broadcasters make informed decisions about programming, scheduling, and content creation.
How can broadcasters use broadcast stats to improve their content?
Broadcasters can use broadcast stats to identify trends, understand audience preferences, and make data-driven decisions about content creation and programming. By analyzing the data, broadcasters can tailor their content to better meet the needs and interests of their audience.
What are some common tools and methods used to collect broadcast stats?
Common tools and methods used to collect broadcast stats include audience measurement systems, ratings and viewership data, social media analytics, surveys and feedback forms, and digital analytics platforms. These tools help broadcasters gather and analyze data to understand audience behavior and preferences.