


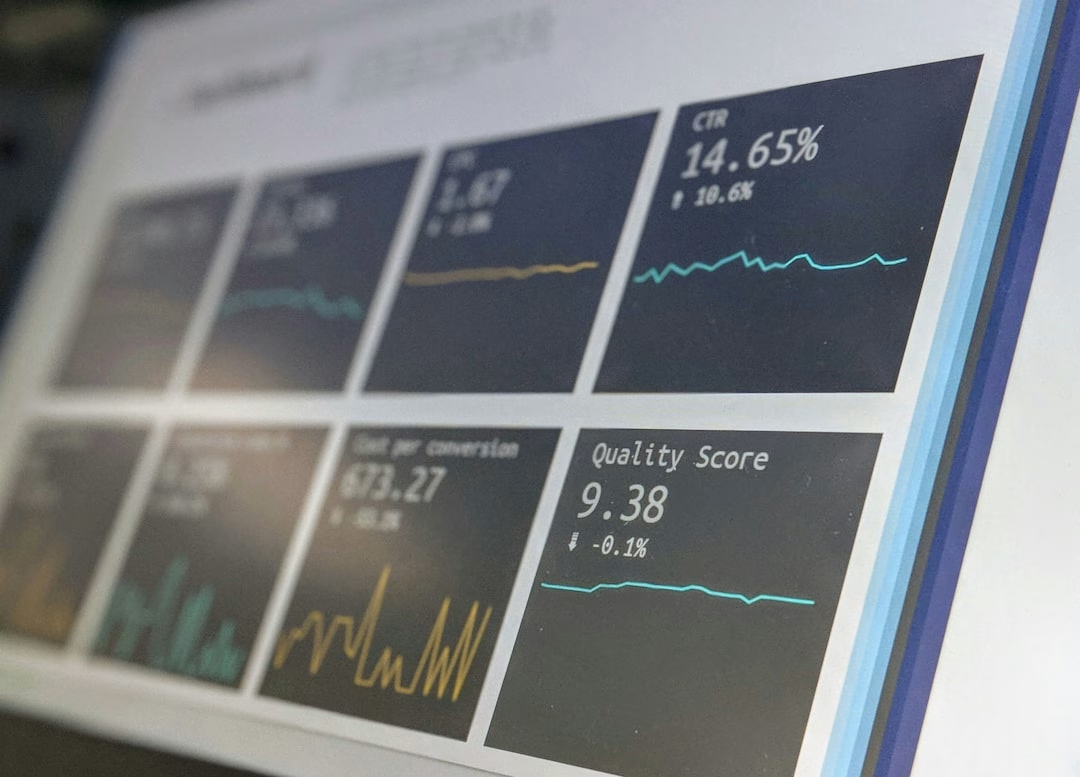
Redefining Your Email Reporting Strategy
You’ve painstakingly crafted your email campaigns, segmented your lists with precision, and unleashed a barrage of carefully worded messages into the digital ether. But how do you truly know if your efforts are paying off? Are your marketing emails genuinely resonating with your audience, driving conversions, and contributing to your bottom line? The answer, or at least a significant part of it, lies in the quality of your email performance reports. Far too often, these reports become a mere collection of vanity metrics, failing to provide actionable insights that can genuinely improve future campaigns. It’s time to move beyond the superficial and dive deep into what makes a truly impactful email report.
You might be looking at open rates, click-through rates, and bounce rates, and while these are undoubtedly important, they represent only a fraction of the story. To truly improve your email performance, you need to understand the ‘why’ behind these numbers. Why did a particular subject line perform better? Why did one call-to-action outshine another? Why are certain segments more engaged than others? Answering these questions requires a more sophisticated approach to reporting, one that connects email metrics directly to your overarching marketing objectives. You need to transform your reports from simple data dumps into powerful analytical tools that empower your team to make data-driven decisions.
This transformation begins with a clear understanding of your goals. Before you even think about which metrics to track, you must define what success looks like for your email marketing efforts. Are you aiming to increase brand awareness, drive website traffic, generate leads, or boost sales? Each of these objectives will necessitate a different set of key performance indicators (KPIs) and a different reporting focus. Without this foundational understanding, your reports will lack direction and, consequently, actionable value. You’ll find yourself drowning in data without a clear path forward.
Remember, your email reports are not just for you. They are for your entire marketing team, for stakeholders, and potentially for management. Therefore, clarity, conciseness, and a focus on insights are paramount. You need to present information in a way that is easily digestible and compelling, highlighting the key takeaways and recommending clear next steps. The goal is not just to report data, but to inspire action and drive continuous improvement.
In the quest for improved email performance, marketing teams can benefit from exploring related strategies that enhance their outreach efforts. A valuable resource on this topic is the article titled “Automating Your News Digest Newsletter with the Curator Economy,” which discusses innovative approaches to streamline email content curation and distribution. By implementing automation in their email campaigns, teams can not only save time but also increase engagement rates. For more insights, you can read the article here: Automating Your News Digest Newsletter with the Curator Economy.
Establishing Foundational Metrics and KPIs

Before you can build a robust reporting system, you need to solidify your understanding of the core metrics and define your key performance indicators (KPIs). These are the bedrock upon which all your deeper analysis will be built. While the specific KPIs will vary based on your objectives, there are several foundational metrics you should always track and understand. Don’t just collect them; truly comprehend what each one signifies for your campaigns.
Essential Engagement Metrics
You’re likely already familiar with these, but it’s crucial to understand their nuances and how they interrelate.
- Open Rate: This metric tells you the percentage of recipients who opened your email. A high open rate suggests your subject line is compelling, your sender name is recognizable, and your email deliverability is good. However, remember that open rates can be inflated by Apple’s Mail Privacy Protection, so interpret this metric with caution and look for trends rather than absolute values. You should be segmenting your open rates by device and email client to get a more accurate picture.
- Click-Through Rate (CTR): This is the percentage of recipients who clicked on at least one link within your email. A strong CTR indicates that your email content is relevant, your call-to-action (CTA) is clear and compelling, and the overall design encourages interaction. This is often a more reliable indicator of engagement than open rate alone.
- Click-to-Open Rate (CTOR): This metric takes CTR a step further by calculating the percentage of opened emails that resulted in a click. It provides a more refined view of how engaging your content is after the email has been opened. A high CTOR suggests your content successfully captivated the audience who bothered to open your email.
- Unsubscribe Rate: This measures the percentage of recipients who opted out of your email list. While some unsubscribes are inevitable, a consistently high rate suggests issues with content relevance, email frequency, or list segmentation. Monitor this closely, as it can indicate broader problems with your email strategy.
- Bounce Rate: This represents the percentage of emails that couldn’t be delivered. Bounces can be “hard” (permanent delivery failure, e.g., invalid email address) or “soft” (temporary failure, e.g., full inbox). A high bounce rate impacts your sender reputation and deliverability, so clean your lists regularly.
Performance-Based KPIs
These metrics directly tie into your business objectives and are crucial for demonstrating the ROI of your email marketing efforts.
- Conversion Rate: This is arguably the most important KPI, measuring the percentage of recipients who completed a desired action after clicking through from your email (e.g., made a purchase, filled out a form, downloaded a resource). This metric directly links your email efforts to business outcomes. You should be tracking this through proper UTM tagging and web analytics integration.
- Revenue Per Email: For e-commerce businesses, this KPI calculates the total revenue generated from an email campaign divided by the number of emails sent. It provides a clear financial value for each email you send.
- Average Order Value (AOV): If your emails are driving sales, understanding the AOV of customers who convert from email campaigns can provide valuable insights into their purchasing behavior and the effectiveness of your product recommendations.
- Lead Quality/Quantity: If your primary goal is lead generation, track the number of leads generated through email and, more importantly, their quality. Are these leads progressing through your sales funnel at a higher rate than leads from other channels?
- List Growth Rate: While not directly tied to a single campaign’s performance, monitoring your list growth rate is essential for the long-term health of your email program. A healthy list is a growing list, assuming you’re acquiring subscribers ethically and relevantly.
By consistently tracking these foundational metrics and performance-based KPIs, you’ll have a solid basis for evaluating your email performance. But remember, data without context is just noise. The real power comes from analyzing these numbers in conjunction with your campaign objectives and audience segments.
Moving Beyond Basic Metrics: Deep Dive into Analysis

Once you have your foundational metrics in place, your next step is to move beyond simply presenting numbers and start analyzing them. This is where you transform raw data into actionable insights. You need to ask “why” and “how” repeatedly, dissecting your campaigns to understand the underlying drivers of performance.
Segmenting Your Data for Deeper Understanding
You can’t expect to understand your audience if you treat them as a monolithic entity. Segmenting your email performance data is paramount to uncovering meaningful patterns and tailoring your strategies.
- Audience Segment Analysis: Compare how different segments (e.g., new subscribers, loyal customers, inactive users, demographic groups) respond to the same email or different campaigns. Do loyal customers have higher open and click rates for product updates? Are new subscribers more responsive to welcome series content? This analysis helps you refine your segmentation strategy and personalize content more effectively.
- Campaign Type Analysis: Categorize your emails (e.g., promotional, newsletter, transactional, re-engagement, abandonment) and analyze their performance independently. You wouldn’t expect a transactional email to have the same CTR as a promotional email, so comparing them directly isn’t helpful. This allows you to set realistic expectations and optimize each campaign type for its specific purpose.
- Content Type Analysis: Evaluate the performance of different content elements within your emails. Which blog post links generated the most clicks? Which product categories garnered the most interest? A/B test different headlines, body copy, images, and CTAs to understand what resonates best with your audience. This iterative testing is crucial for continuous improvement.
- Time and Day Analysis: Does sending at a specific time or day yield better results? Analyze open and click rates based on send time. While there are general best practices, your unique audience may have different optimal engagement windows. Experiment and find what works for you.
- Device Analysis: With mobile browsing becoming dominant, understanding how your emails perform on different devices (desktop vs. mobile) is critical. Are your emails rendering correctly on all devices? Are mobile users clicking less because of poor formatting or tiny buttons? This informs your responsive design strategy.
Interpreting Trends and Identifying Anomalies
Don’t just look at single campaign results in isolation. You need to analyze performance over time to identify trends and spot any unusual spikes or dips.
- Historical Performance Comparison: Compare current campaign performance against past campaigns of a similar type. Are your open rates consistently declining? Is your conversion rate steadily increasing? Understanding these trends helps you evaluate the long-term effectiveness of your strategies and identify areas that need intervention.
- Benchmarking Against Industry Averages: While every business is unique, comparing your performance to industry benchmarks can provide a useful external perspective. Are you outperforming or underperforming your competitors? This can highlight areas where you excel or where you need to catch up. However, use these benchmarks as a guide, not a definitive judgment.
- Anomaly Detection: Be on the lookout for unexpected results. A sudden drop in open rates could indicate deliverability issues or a problem with your sender reputation. A massive spike in clicks could be a sign of bot activity or a viral, but potentially misleading, subject line. Investigate anomalies to understand their root causes and take corrective action.
Connecting Email Performance to Business Outcomes
The ultimate goal of your analysis is to demonstrate the impact of email marketing on your overall business objectives.
- Attribution Modeling: Understand how email contributes to conversions alongside other marketing channels. Are your emails initiating the customer journey, assisting in later stages, or closing sales? Using multi-touch attribution models can provide a more holistic view of email’s value.
- Customer Lifetime Value (CLTV): Analyze the CLTV of customers acquired or retained through email marketing. Are email-acquired customers more valuable in the long run? This can justify further investment in your email program.
- Return on Investment (ROI): Calculate the ROI of your email campaigns by comparing the revenue generated from email against the costs associated with running your email program (e.g., ESP fees, content creation, staff time). This is crucial for demonstrating the financial value of email marketing to stakeholders.
By engaging in this level of deep analysis, you move beyond mere reporting and transform your data into a strategic asset. You’ll be able to tell a compelling story about your email performance and make informed decisions that drive real business growth.
Crafting Actionable Reports and Visualizations
Collecting and analyzing data is only half the battle. The true value comes from presenting that information in a way that is clear, concise, and most importantly, actionable. Your reports should empower your team and stakeholders to understand performance at a glance and identify immediate next steps. Poorly structured or overly complex reports will be ignored, regardless of the quality of the underlying data.
Designing for Clarity and Impact
Your report’s design plays a crucial role in its effectiveness. You need to guide the reader through the information, highlighting what matters most.
- Executive Summary: Always start with a concise executive summary. This should provide a high-level overview of key performance highlights, challenges, and immediate recommendations. Your busy stakeholders might only read this section, so make it count. Focus on the “so what?” and the “now what?”
- Audience-Centric Structure: Tailor your report to its intended audience. A report for your email marketing specialists might dive deep into technical metrics and A/B test results, while a report for the CEO will focus on revenue, ROI, and overall strategic impact. You might even consider creating different versions of the report for different audiences.
- Visualizations Over Tables: While tables are useful for raw data, charts and graphs make trends and comparisons immediately apparent. Use bar charts for comparing campaign performance, line graphs for showing trends over time, and pie charts for illustrating proportions (though be careful not to overuse them for too many segments).
- Key Takeaways and Recommendations: Don’t just present data; interpret it. For each section, include clear bullet points outlining the key takeaways and specific, actionable recommendations. For example, instead of just stating “Open rates decreased by 5%,” say, “Open rates decreased by 5% for our weekly newsletter. Recommendation: A/B test new subject line strategies focusing on personalization and urgency.”
- Contextual Information: Always provide context. If a metric is unusually high or low, explain why. Did you send to a highly engaged segment? Was there a major holiday that impacted engagement? This prevents misinterpretations and provides a fuller picture.
Leveraging Effective Visualizations
Choosing the right visualization for your data can dramatically improve comprehension and engagement with your reports.
- Trend Lines for Open/Click Rates: Use line graphs to display open rates, click-through rates, and conversion rates over time. This immediately reveals whether performance is improving, declining, or staying consistent. Overlay multiple campaigns or segments for easy comparison.
- Bar Charts for Campaign Comparison: When comparing the performance of different campaigns (e.g., monthly newsletters, promotional emails for different products), bar charts are excellent for visualizing which performed best across key metrics like CTR and conversions.
- Funnel Visualizations for Conversions: For email sequences or journeys, a funnel chart can effectively illustrate the progression of users through different stages (e.g., opened, clicked, visited product page, added to cart, purchased). This highlights drop-off points where optimization is needed.
- Heatmaps for Click Analysis: If your email platform offers it, a heatmap showing where users clicked within your email provides incredible insight into which elements are most engaging. This can inform future design and content placement.
- Geographic Maps for Audience Distribution: If your audience is global or geographically diverse, a map showing where opens and clicks are originating can be insightful for targeting and content localization.
Automating and Iterating Your Reporting
Manual report generation is time-consuming and prone to error. Embrace automation to free up your team for analysis and strategy.
- Email Service Provider (ESP) Reports: Your ESP will have built-in reporting features. Familiarize yourself with them and leverage their capabilities for standard metrics. Many ESPs also allow for custom report building.
- Integrate with Analytics Platforms: Connect your ESP data with Google Analytics or other web analytics platforms. This is crucial for tracking conversions and understanding the full customer journey post-email click. Use UTM parameters religiously for every link in your emails.
- Dashboard Tools: Consider using dedicated business intelligence (BI) or dashboard tools (e.g., Google Data Studio, Tableau, Power BI) to create dynamic, interactive reports that pull data from various sources. This allows stakeholders to drill down into specifics as needed.
- Regular Reporting Cadence: Establish a consistent reporting schedule (e.g., weekly, monthly, quarterly). This ensures continuous monitoring and allows for timely adjustments.
- Seek Feedback and Iterate: Your reports are not static. Ask your team and stakeholders for feedback. Are they finding the reports useful? Is there any information missing or presented unclearly? Use this feedback to continuously refine and improve your reporting process.
By focusing on clear design, effective visualizations, and actionable insights, you’ll transform your email performance reports from mere data summaries into powerful tools for strategic decision-making and continuous improvement.
In the quest for improved email performance, marketing teams can greatly benefit from understanding the importance of data integrity across their platforms. A related article discusses how syncing your e-commerce store with email can enhance data accuracy and reporting, ultimately leading to better decision-making and strategy formulation. For more insights on this topic, you can read the article on syncing your e-commerce store with email. This connection between email marketing and e-commerce data can help teams refine their performance reports and drive more effective campaigns.
Continuous Optimization Through A/B Testing and Experimentation
| Metric | Importance | Impact on Marketing | Why Better Reporting Helps |
|---|---|---|---|
| Open Rate | High | Measures initial engagement and subject line effectiveness | Identifies which subject lines and send times work best |
| Click-Through Rate (CTR) | High | Indicates how compelling the email content and call-to-action are | Helps optimize content and links for better conversions |
| Bounce Rate | Medium | Shows email deliverability and list quality | Enables cleaning of email lists to improve sender reputation |
| Unsubscribe Rate | Medium | Reflects audience satisfaction and relevance of content | Helps tailor content to reduce churn and retain subscribers |
| Conversion Rate | High | Measures the success of email in driving desired actions | Allows tracking ROI and refining campaigns for better results |
| Spam Complaint Rate | High | Impacts sender reputation and deliverability | Helps identify problematic content or targeting issues |
| List Growth Rate | Medium | Indicates the effectiveness of lead generation efforts | Supports strategies to expand audience reach |
You’ve got your reports, you’re analyzing data, and you’re presenting actionable insights. But the cycle doesn’t end there. The true power of robust reporting comes when it fuels continuous optimization. This means embracing a culture of A/B testing and experimentation, where every report provides hypotheses for your next tests. Without this iterative approach, your email marketing efforts will stagnate.
Formulating Hypotheses from Report Insights
Your reports are not just historical documents; they are fertile ground for future experiments. Every insight you gain should lead to a testable hypothesis.
- Identify Underperforming Elements: Your reports will highlight areas where performance is weak. For example, a low open rate suggests your subject lines or sender names aren’t compelling. A low CTR indicates issues with your content or CTA. These are prime candidates for A/B testing.
- Spot Opportunities for Improvement: Conversely, if certain content types or segments consistently perform well, explore why they do. Can you replicate that success in other areas? This could lead to testing similar approaches with different segments or content.
- Analyze Segment-Specific Behaviors: If your reports show that a specific segment consistently ignores a particular type of email, hypothesize about what content or offer would resonate with them. Then, test that hypothesis.
- Examine Conversion Funnel Drop-offs: If your reports indicate a significant drop-off between email clicks and actual conversions on your landing page, hypothesize about changes to the landing page or the offer itself that could bridge that gap. This highlights the interconnectedness of your entire marketing funnel.
Designing Effective A/B Tests
Once you have a hypothesis, you need to design a test that will definitively prove or disprove it. A well-designed A/B test is crucial for drawing valid conclusions.
- Isolate One Variable: The golden rule of A/B testing is to test one variable at a time. If you change both the subject line and the CTA, you won’t know which change caused the performance difference. Focus on one element, whether it’s the subject line, sender name, body copy, image, CTA text, CTA button color, email layout, or send time.
- Define Your Metrics of Success: Before you even send the test, clearly define what metric you’re trying to improve. Is it open rate, CTR, conversion rate, or revenue per email? This metric will be your primary indicator of which variation “wins.”
- Ensure Statistical Significance: Don’t stop a test too early. You need a sufficient sample size and enough time to achieve statistical significance. Many A/B testing tools will calculate this for you, but understanding the concept is vital. A difference in performance might just be random chance if your sample size is too small.
- Randomize Your Audience: Split your audience randomly into your A and B groups (and potentially C, D, etc., for multivariate tests). This ensures that any differences in performance are due to your variable change, not inherent differences between the groups.
- Run Tests Concurrently: Whenever possible, run your A/B tests at the same time. This minimizes the impact of external factors (like news events or competitor campaigns) that could skew your results if the tests were run sequentially.
Analyzing Test Results and Implementing Learnings
The test isn’t over when the emails are sent. The analysis and implementation phase is where the real value is extracted.
- Thorough Data Analysis: Once the test concludes with statistical significance, dive into the data. Which variation performed better for your primary metric? Did it also impact secondary metrics (e.g., did an improved open rate lead to a lower CTOR because the content didn’t live up to the subject line’s promise)?
- Document Learnings: Create a centralized repository for your A/B test results and learnings. This prevents repeating tests and builds a valuable knowledge base for your team. Document the hypothesis, the variations, the results, and the key takeaways.
- Implement Winning Strategies: Don’t just celebrate the win; implement the winning variation across your future campaigns. This is where the optimization truly happens.
- Iterate and Test Again: A winning test often leads to new hypotheses. For example, if a new subject line format performed better, can you optimize the body copy or CTA to further enhance the email’s effectiveness? Email marketing is an endless cycle of testing, learning, and refining.
- Share Insights Broadly: Share your A/B test results and learnings with your broader marketing team. Insights from email tests can often inform strategies for other channels, such as social media ad copy or website headlines.
By embedding A/B testing and continuous experimentation into your email marketing workflow, driven by the insights from your performance reports, you create a powerful engine for ongoing improvement. You move from simply understanding what happened to proactively shaping what will happen next, leading to increasingly effective and impactful email campaigns.
Enhancing Deliverability and Sender Reputation
Even the most meticulously crafted email, with the most compelling subject line and conversion-driven content, is useless if it doesn’t reach the inbox. Your email performance reports, therefore, must include metrics and analysis related to deliverability and sender reputation. Neglecting this crucial aspect means all your other optimization efforts could be in vain. You need to actively monitor and maintain the health of your email sending infrastructure.
Key Deliverability Metrics to Monitor
Your ESP typically provides these metrics, but you need to understand their significance and how to act upon them.
- Bounce Rate (Hard and Soft): We touched on this earlier, but it’s worth reiterating its importance for deliverability.
- Hard Bounces: These are permanent delivery failures, usually due to an invalid email address. A high hard bounce rate signals a poor-quality list and can severely damage your sender reputation. You should immediately remove hard-bounced addresses from your list.
- Soft Bounces: These are temporary failures, like a full inbox or server issues. While less damaging than hard bounces, a persistent high soft bounce rate could indicate an issue with your content (triggering spam filters) or timing. Monitor these and investigate if they become unusually high for a particular campaign or domain.
- Spam Complaint Rate: This is the percentage of recipients who marked your email as spam. This is arguably the most damaging metric for your sender reputation. Even a small percentage can lead to blocklisting by ISPs. Keep this rate as close to zero as possible. Your ESP should provide this data.
- Blocklist Monitoring: Regularly check if your sending IP address or domain has been placed on any major spam blocklists (e.g., Spamhaus, Barracuda). Being on a blocklist means your emails will likely not reach their intended recipients. Your ESP should notify you of these issues, but proactive monitoring is also beneficial.
- Engagement Metrics (as Deliverability Indicators): ISPs increasingly use engagement (opens, clicks, replies, forwards) as a signal of sender trustworthiness. Low engagement signals can lead to emails landing in the spam folder even if they aren’t explicitly marked as spam. Therefore, your open and click rates aren’t just for content performance; they are also crucial for deliverability.
- Inbox Placement Rate: This is the ultimate deliverability metric: the percentage of your emails that actually land in the primary inbox. Unfortunately, this is harder to track directly from your ESP. You might need specialized deliverability tools or seed list testing to get an accurate picture.
Strategies for Improving Deliverability
Based on your deliverability reports, you can implement strategies to safeguard and improve your sender reputation.
- Maintain a Clean and Segmented List: Regularly clean your email list by removing inactive subscribers, hard bounces, and those who haven’t engaged in a long time. Implement re-engagement campaigns for dormant subscribers; if they don’t respond, remove them. Segmenting your list ensures you’re sending relevant content to interested recipients, which boosts engagement and reduces spam complaints.
- Implement Double Opt-in: While it might slightly reduce list growth, double opt-in (where subscribers confirm their subscription via an email) significantly improves list quality and reduces spam complaints, as only genuinely interested individuals make it onto your list.
- Authenticate Your Emails (SPF, DKIM, DMARC): Ensure your email authentication protocols (Sender Policy Framework, DomainKeys Identified Mail, and Domain-based Message Authentication, Reporting & Conformance) are correctly set up. These verify that your emails are legitimately coming from your domain, preventing spoofing and improving trust with ISPs. Work with your IT team or ESP to ensure these are in place.
- Monitor Sending Volume and Frequency: Avoid sudden, large spikes in sending volume, as this can trigger spam filters. Gradually increase your sending volume if you’re a new sender or significantly expanding your list. Send emails at a consistent, appropriate frequency that matches your audience’s expectations.
- Optimize Email Content: Avoid spam trigger words, excessive capitalization, too many exclamation points, and overly large images without corresponding text. Ensure your email-to-text ratio is balanced. Use clear, concise language and always provide an easy-to-find unsubscribe link.
- Warm Up New IPs/Domains: If you’re switching ESPs or using a new sending domain/IP, you need to “warm it up” by gradually increasing sending volume over several weeks. This establishes a positive sending history with ISPs.
- Monitor and Act on Spam Complaints: When you receive a spam complaint, investigate its source if possible. If a particular campaign or segment is generating more complaints, analyze why and adjust your strategy.
- Provide a Clear Unsubscribe Process: Make it easy for people to unsubscribe. Hiding the unsubscribe link or making the process convoluted will only frustrate recipients and increase the likelihood of them marking your email as spam instead.
By actively including deliverability metrics in your reports and treating them with the same importance as engagement and conversion metrics, you ensure that your email marketing efforts have the best possible chance of reaching your audience. A healthy sender reputation is the invisible foundation upon which all successful email campaigns are built.
FAQs
What are email performance reports?
Email performance reports are detailed analyses of the effectiveness of email marketing campaigns. They provide insights into key metrics such as open rates, click-through rates, conversion rates, and overall engagement with the emails sent.
Why do marketing teams need better email performance reports?
Marketing teams need better email performance reports to understand the impact of their email campaigns, identify areas for improvement, and make data-driven decisions to optimize their email marketing strategies. Improved reports can help teams track progress, measure success, and ultimately achieve better results.
What key metrics should be included in email performance reports?
Key metrics that should be included in email performance reports are open rates, click-through rates, conversion rates, bounce rates, unsubscribe rates, engagement rates, deliverability rates, and overall ROI. These metrics provide valuable insights into the effectiveness of email campaigns and help teams assess performance.
How can better email performance reports benefit marketing teams?
Better email performance reports can benefit marketing teams by providing actionable insights to improve campaign effectiveness, optimize targeting strategies, enhance customer engagement, increase ROI, and ultimately drive business growth. These reports help teams make informed decisions and continuously improve their email marketing efforts.
What are some best practices for analyzing email performance reports?
Some best practices for analyzing email performance reports include setting clear goals and KPIs, comparing performance over time, segmenting data for targeted analysis, A/B testing different elements, tracking trends and patterns, and using the insights to make data-driven decisions for future campaigns. Regularly reviewing and analyzing email performance reports is essential for continuous improvement and success in email marketing.